Tips#
How to create a Dataset#
1. Open the Datasets page and click the Add button
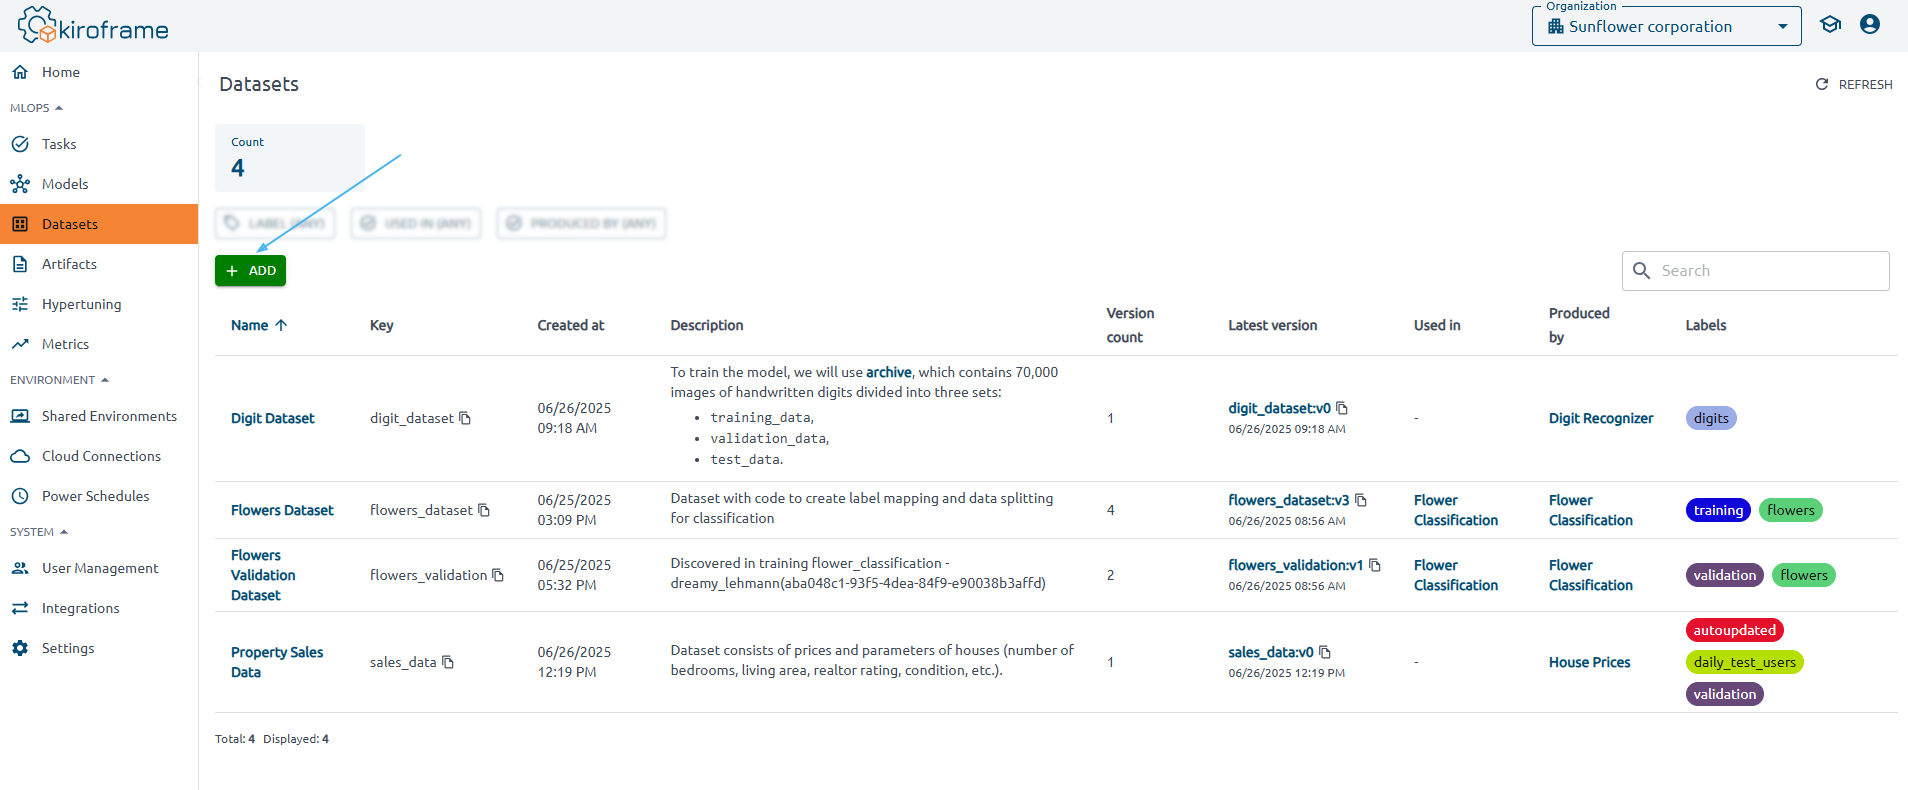
2. When adding a dataset, specify:
-
Key - the dataset path, providing information about the dataset’s source. Used in the dataset method.
-
Name - the name of the dataset, e.g.
"iris_data". -
Description - the dataset description.
-
Labels - the dataset labels.
Initial version parameters:
-
Timespan from/ Timespan to - the dataset validity time.
-
Aliases - assign a mutable, named reference to a initial version. Each alias should be unique.
How to create a Model#
1. Open the Models page and click the Add button
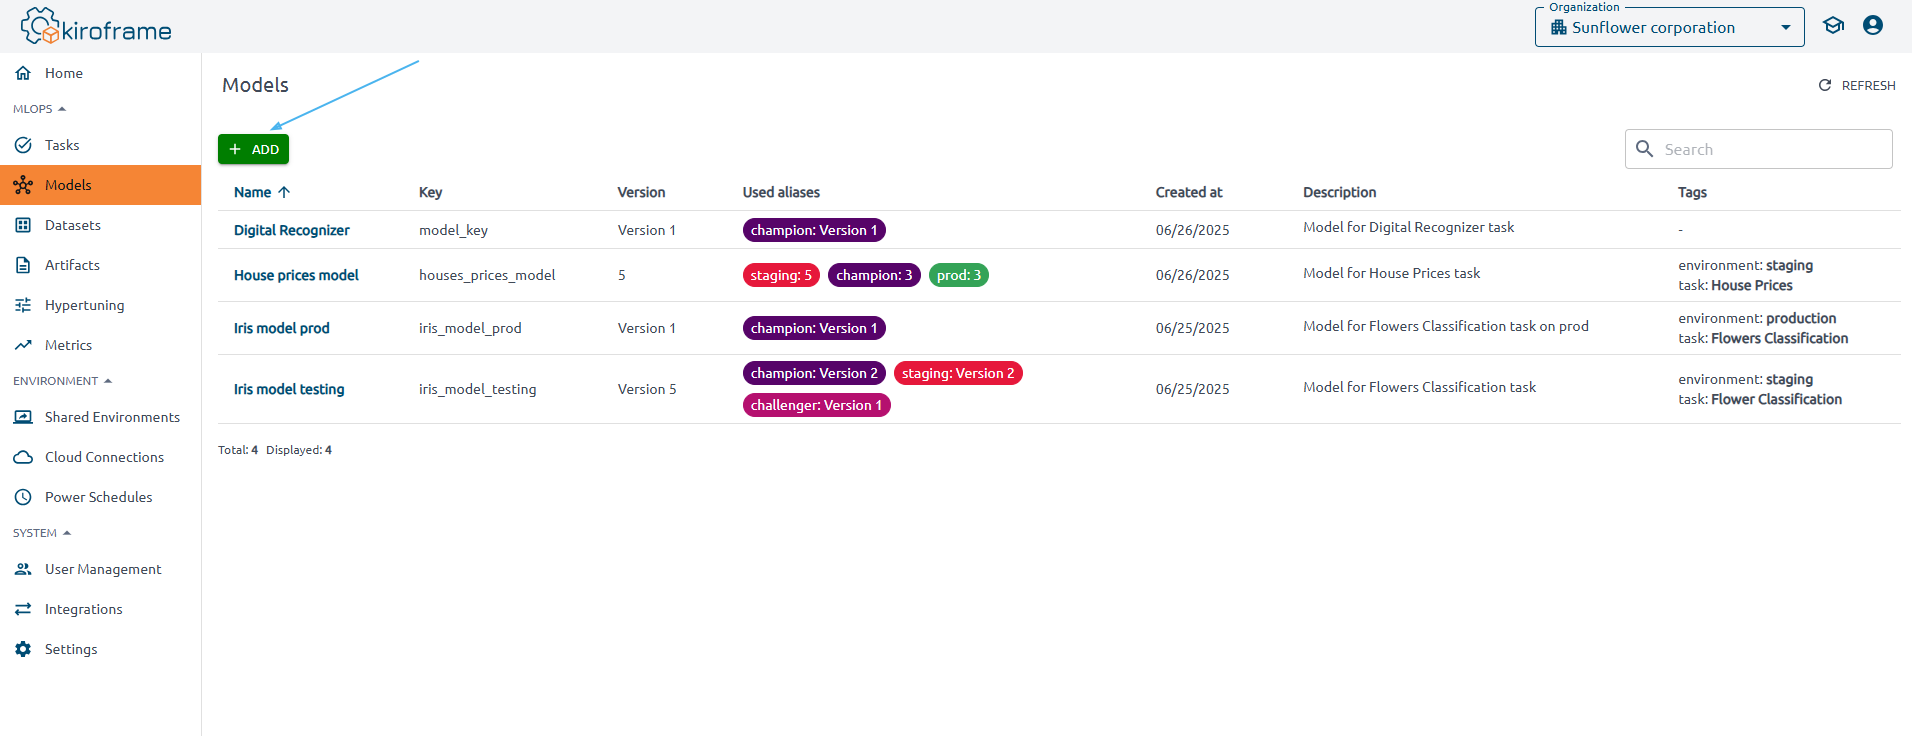
2. Specify in the Add Model page:
-
Name - the name with which the model will be displayed in the interface
-
Key - the model identifier which is used in the model command
-
Description - the model description
-
Tags - the model tags.
Tasks page#
A task is the primary unit of organization and access control for runs; all runs belong to a task. Tasks let you visualize, search for, and compare runs and access run metadata for analysis. Find already created tasks on the Tasks page of the MLOps section of the menu.
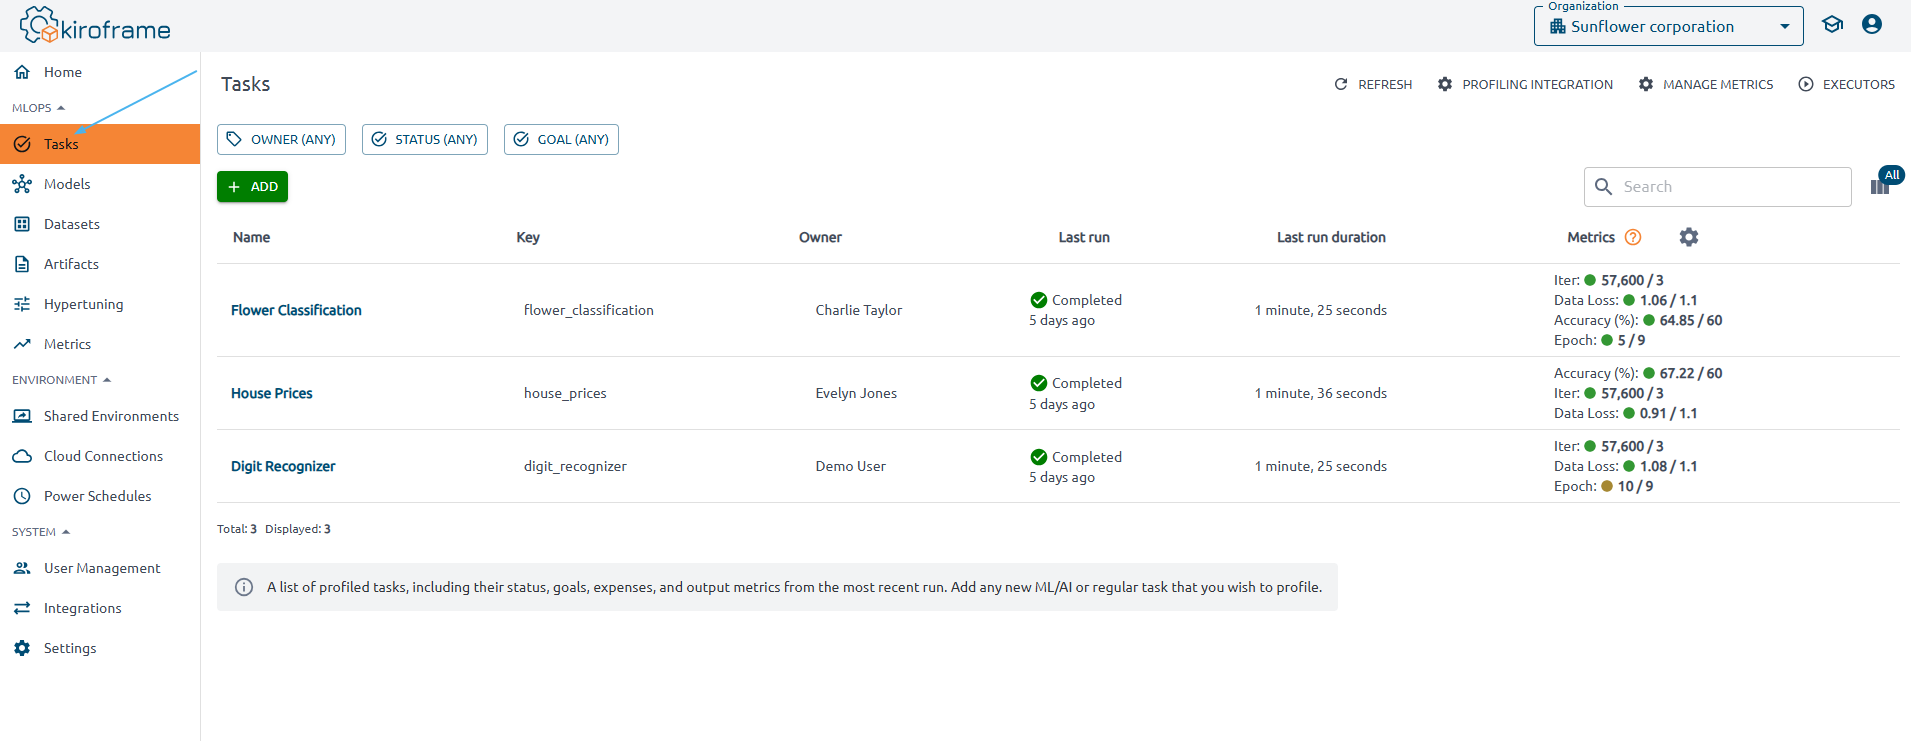
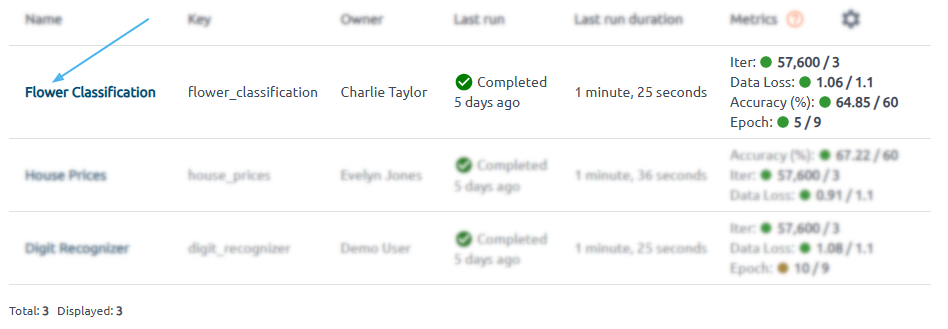
The Tasks page contains a list of profiled tasks, including their key, status, goals, expenses, and output metrics from the most recent run.
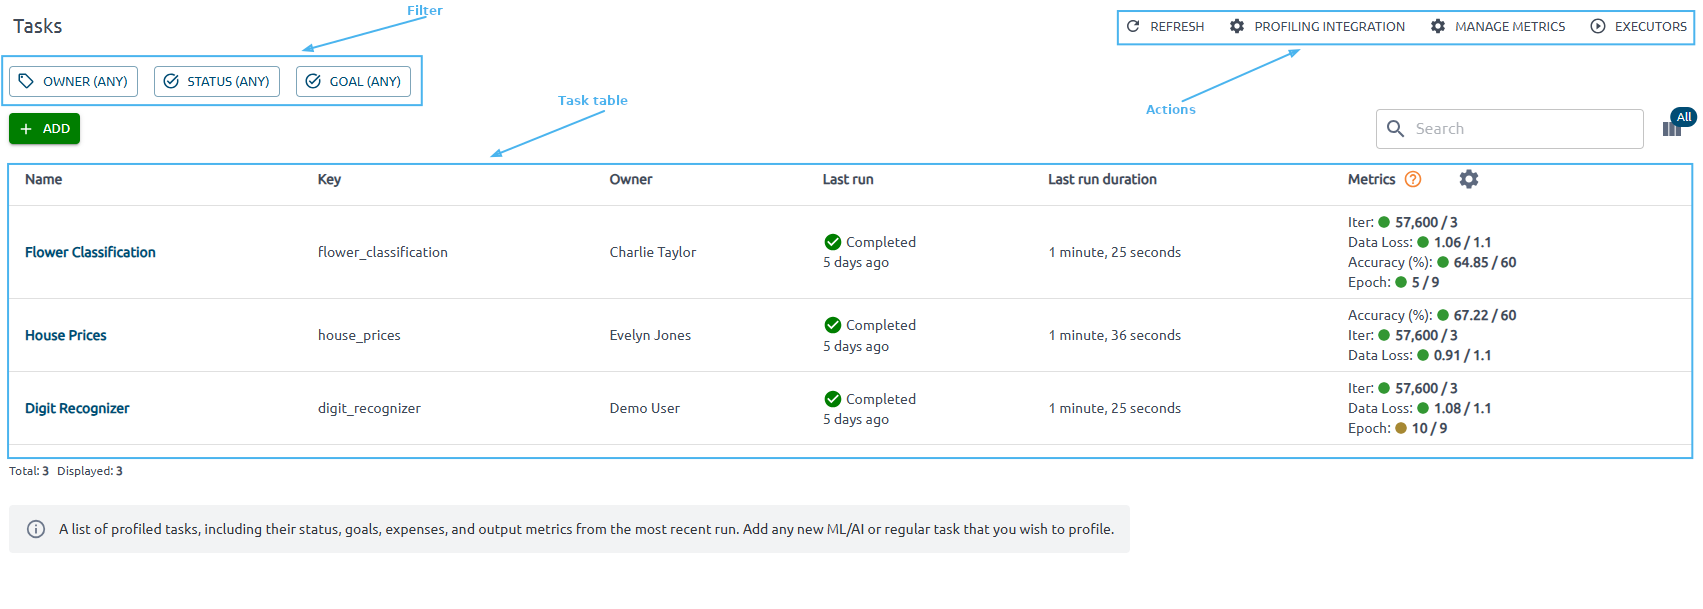
You can also set filters and take action. The Profiling Integration action gives you complete instructions on successfully launching code on your instance to get the result.
Use Manage Metrics to add or edit metrics. Here, you can define a set of metrics against which every module should be evaluated. You can also set a target value and tendency for each captured metric.
Behind the Executors button hides the Executors’ list, showing you compute resources used to run your ML activities.
You can see information about some tasks by clicking on its name.
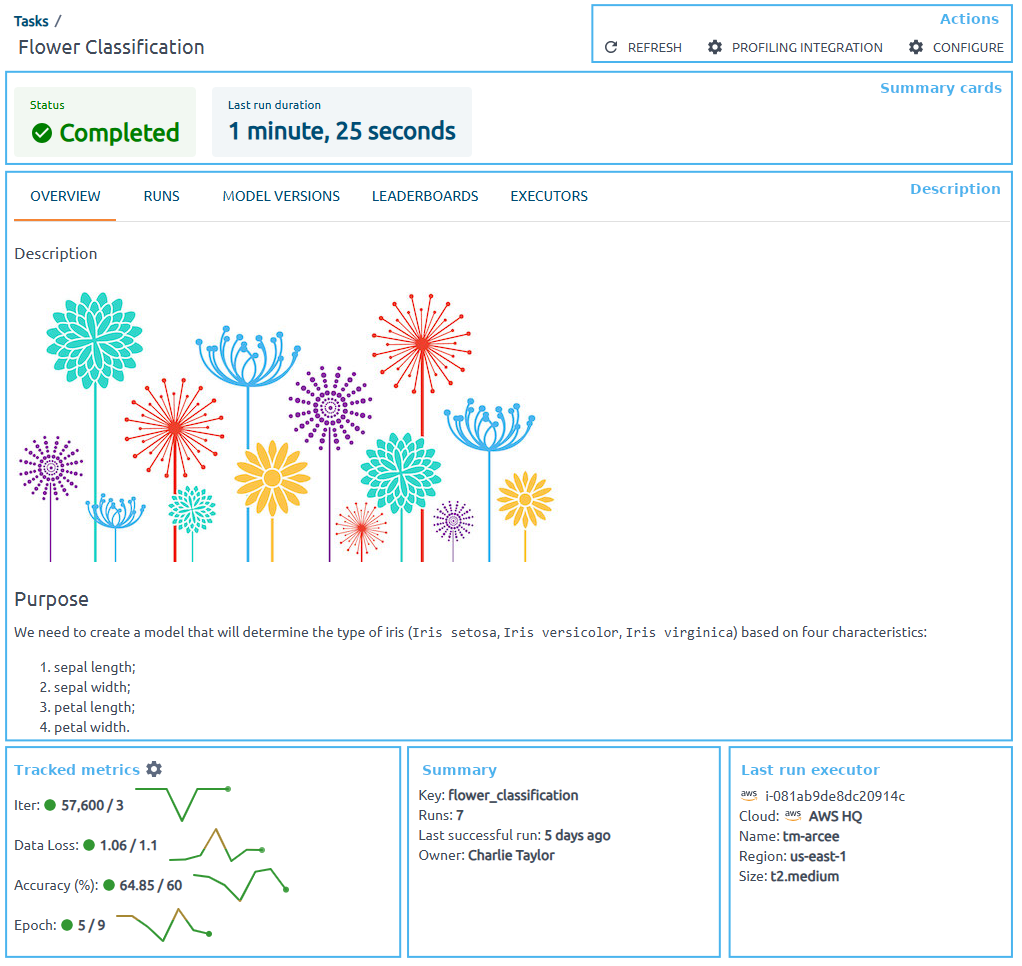
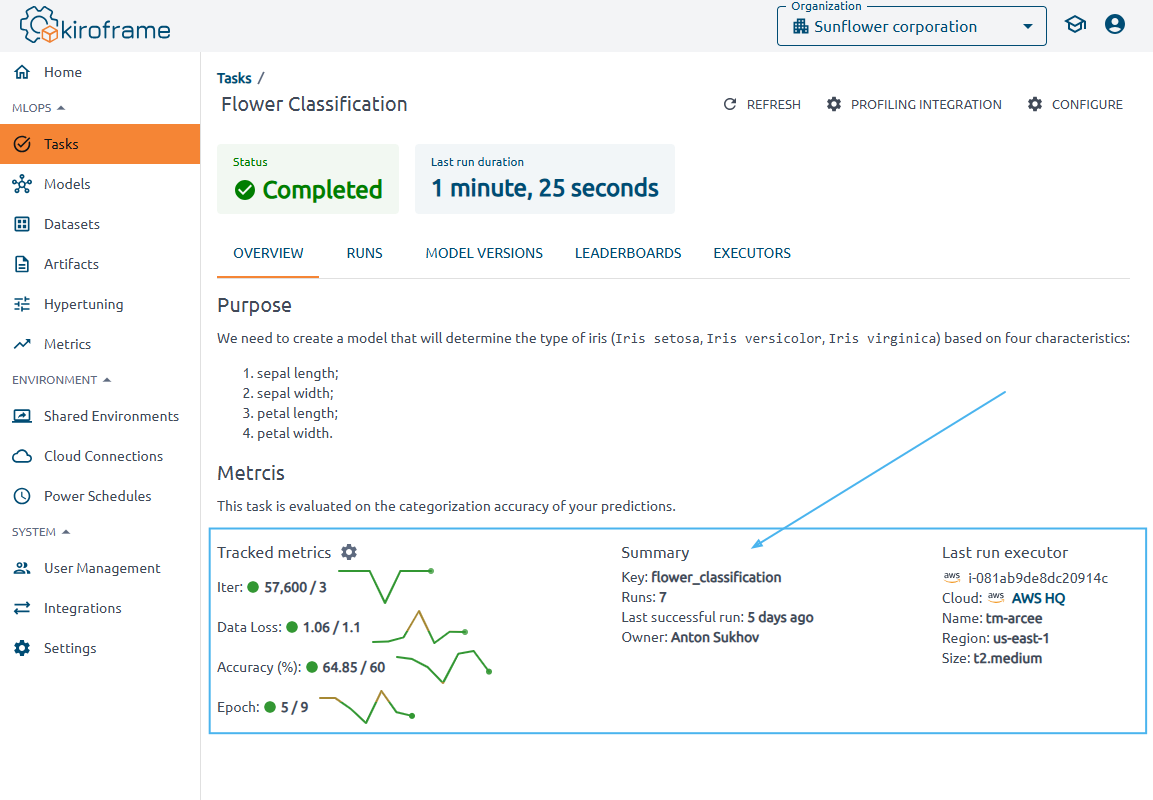
Summary cards contain information about the last run status and last run duration.

Let's take a closer look at the Tracked Metrics section.
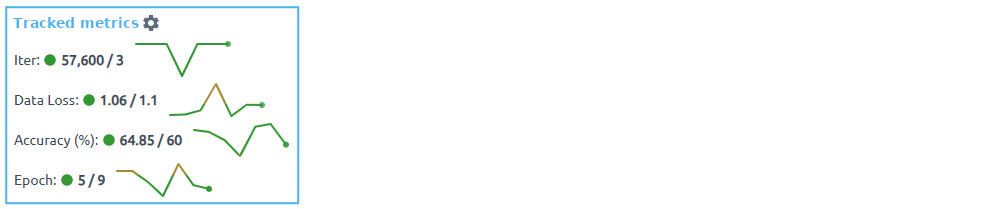
Tracked Metrics are a graphical representation of all runs and specific numbers for the last run. The green circle indicates that the metric has reached the target value under the tendency, while the brown one indicates that it has not. After that, the last run value/target metric value line values for all task runs follow.
![]()
![]()
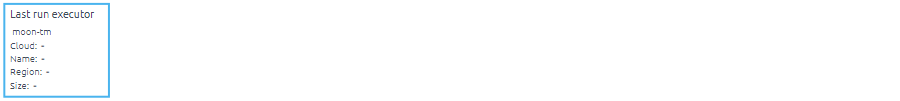
The Last run executor shows on which instance the last run was executed.
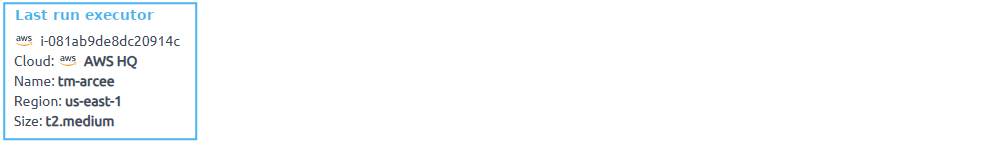
If the executor is known to Kiroframe, you will receive complete information about it and its expenses. Please note that supported clouds are AWS, Azure, Alibaba, and GCP. If the executor is unknown to the Kiroframe, then some information about it will be unavailable. The section will look like it is shown below:
To edit the task, use the Configure button in the Actions menu in the right-hand corner of the page.

How to view training results#
The results of the training code are displayed in Kiroframe. Find them in the Home or MLOps section.
Use the ![]() Community documentation to get a brief description of each page.
Community documentation to get a brief description of each page.
Information on the latest run can be found in four places:
- Home page → Tasks section. View a table displaying the status, execution time, and metric values of the last run for recently used tasks.
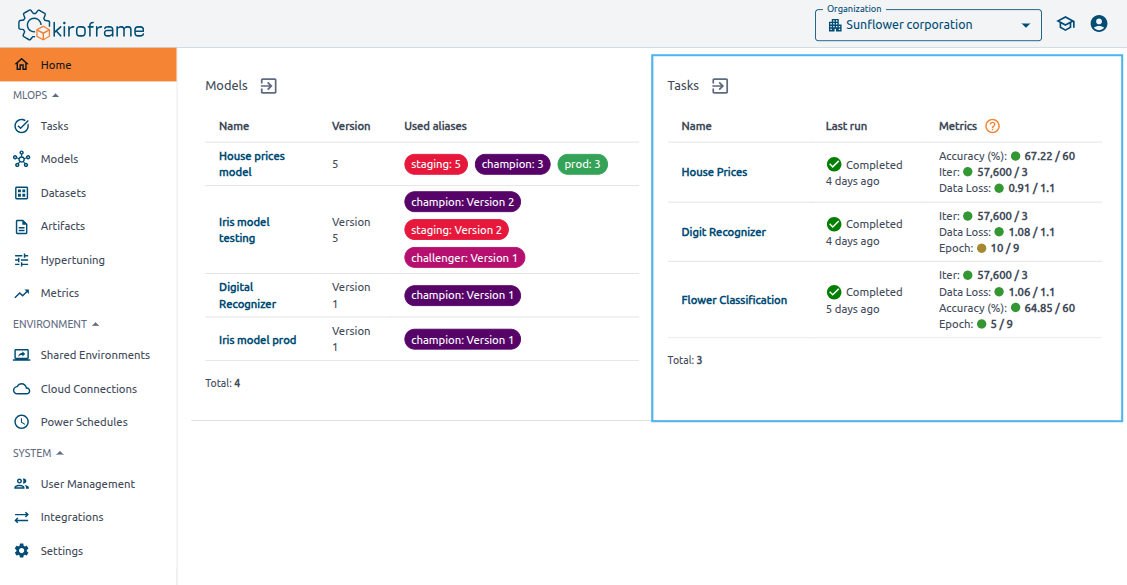
- MLOps → Tasks section. Focus on the Last Run, Last Run Duration, and Metrics columns.

- MLOps → Tasks → click on a task → Overview tab. Observe Tracked metrics. Tracked metrics are a graphical representation of all runs and specific numbers for the last run. Additionally, find information about the instance in which the last run was executed.
- MLOps → Tasks → click on a task → navigate to the Runs tab. Find information about all runs on this page. The last run details are at the top of the table.
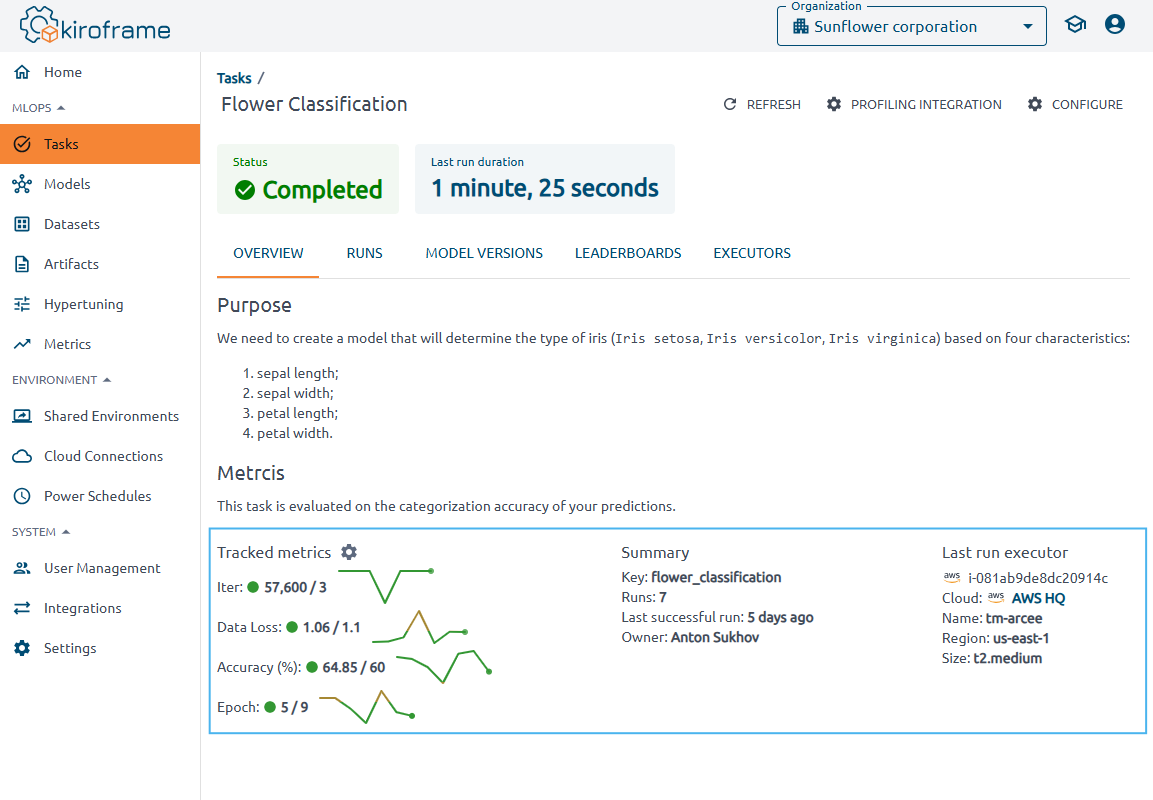
Task details page#
On the Overview tab, beneath the description field, you can view the status of the metrics, including whether they reached their goals, the total number of runs, and the launch time of the last successful run. Details about the Last Run Executor are also displayed.
Find a detailed description of the page in the how tos section of our website.
Runs tab#
Detailed statistics for each run are available in the Runs tab. The information is presented in two formats: graphical and tabular. The graph can be filtered, and you can select metrics and other parameters to display. Hovering over the graph reveals data in a tooltip. The table offers comprehensive details for each run.
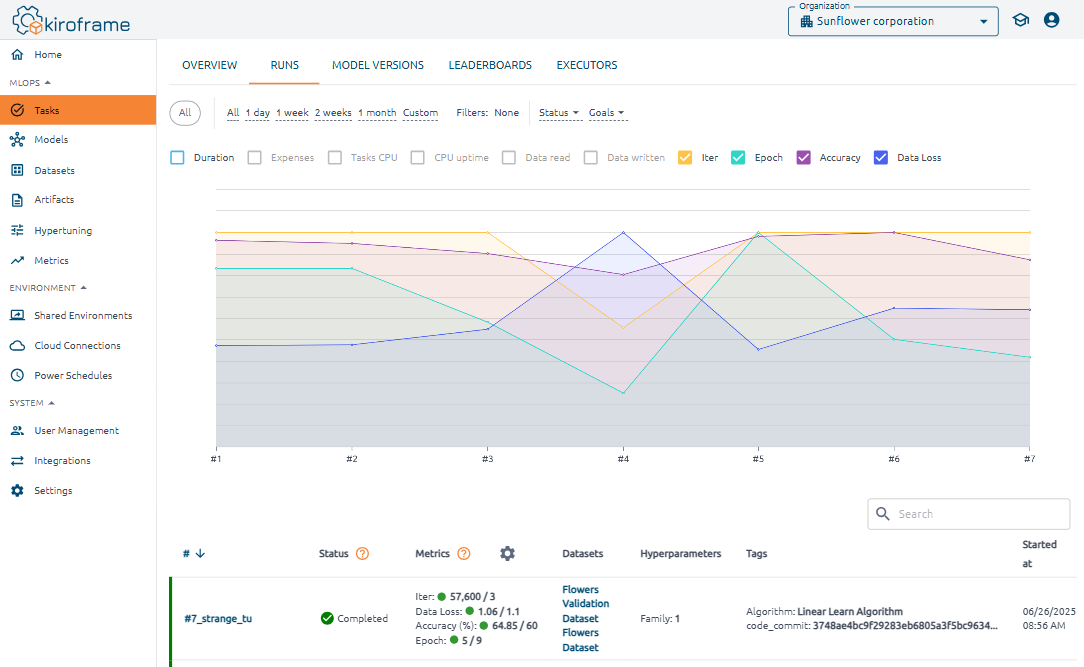
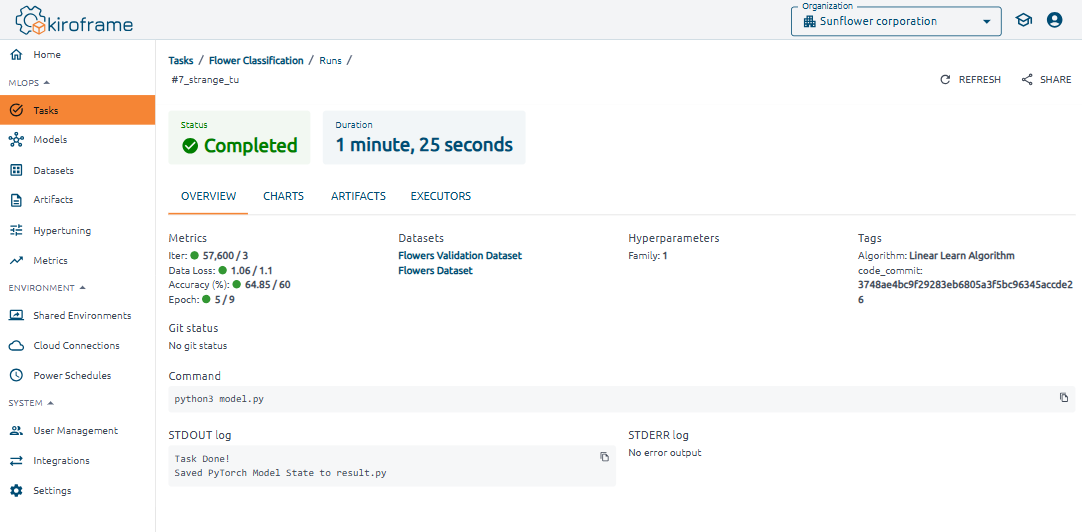
Click on a run to view its Metrics, Datasets, Hyperparameters, Tags, and Charts. Artifacts and Executors are displayed in separate tabs, providing details about their location. You can also find detailed information about the script execution, including its launch source (Git status), the executed command (command), and the console output (logs).
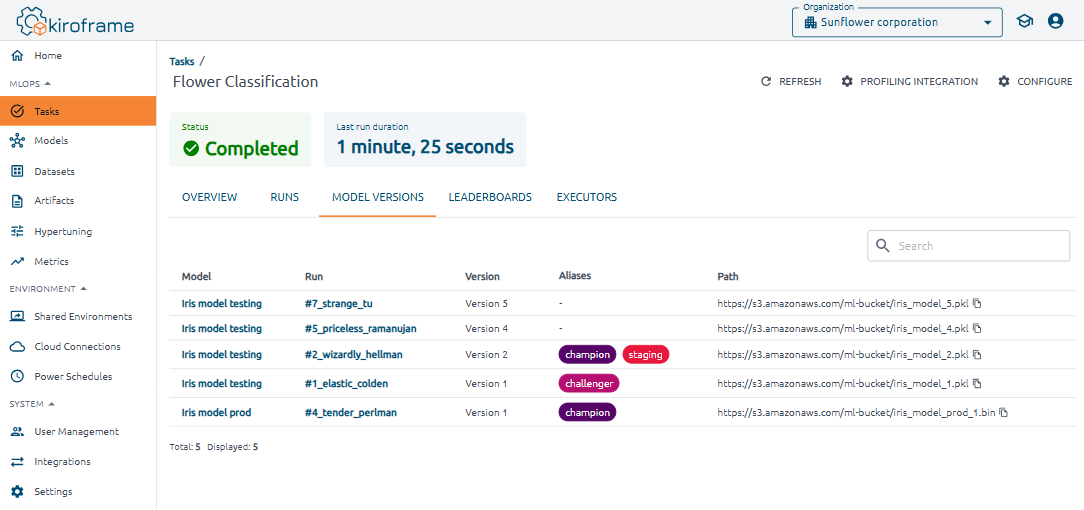
Model version tab#
The table on the Model Version tab displays all versions of models from task runs, along with their parameters. Each row is clickable and provides access to detailed information.
Leaderboards tab#
Compare groups of task runs (candidates) that are organized by hyperparameters and tags to determine the optimal launch parameters. This section also includes convenient functionality for comparing groups of runs.
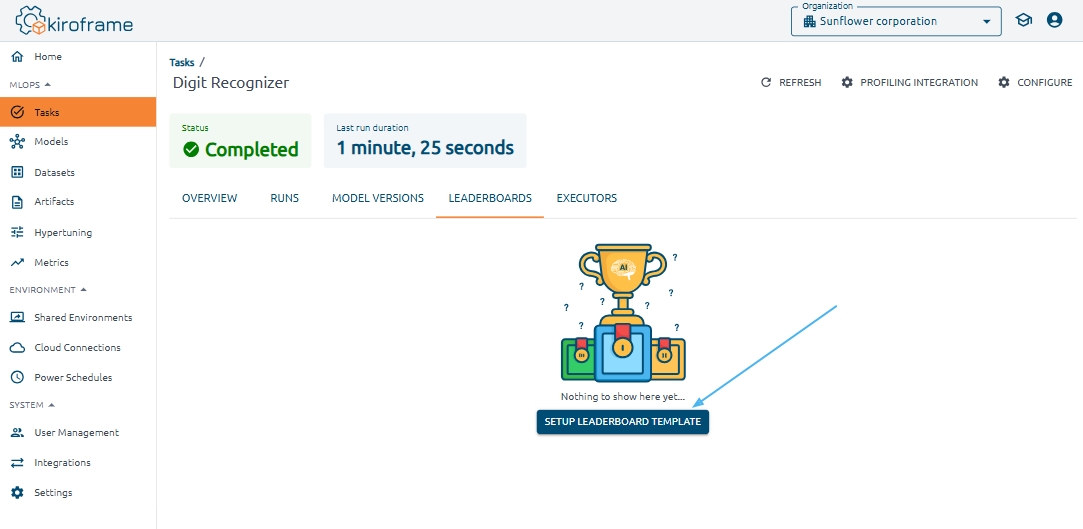
First launch#
The leaderboard template allows you to use a predefined configuration for the leaderboards you create. To create a leaderboard template, go to the Tasks page, select the desired task, click on its name, navigate to the LEADERBOARDS section, and click the SETUP LEADERBOARD TEMPLATE button.
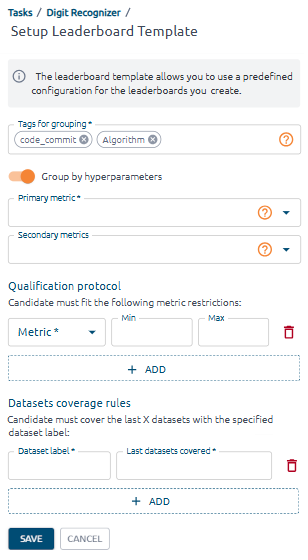
Fill in the Setup Leaderboard Template form:
Primary metric: choose the main performance metric that is the focus for the runs in this leaderboard.
Secondary metrics: specify additional performance metrics to track and compare for the runs in this leaderboard. These metrics offer a broader view of run performance.
Switch on the Group by hyperparameters to include hyperparameters in the formation of groups. The number of groups of runs depends on the number of different hyperparameters.
In the Qualification protocol section, select the metric and specify the minimum and maximum values. Use ![]() to add metrics to the list.
to add metrics to the list.
In the Datasets coverage rules section, select the dataset label and enter the value of the last datasets covered. Use ![]() to add another one rule. To get the list of labels for each dataset, go to the Datasets page. Find the labels in the separate table column.
to add another one rule. To get the list of labels for each dataset, go to the Datasets page. Find the labels in the separate table column.
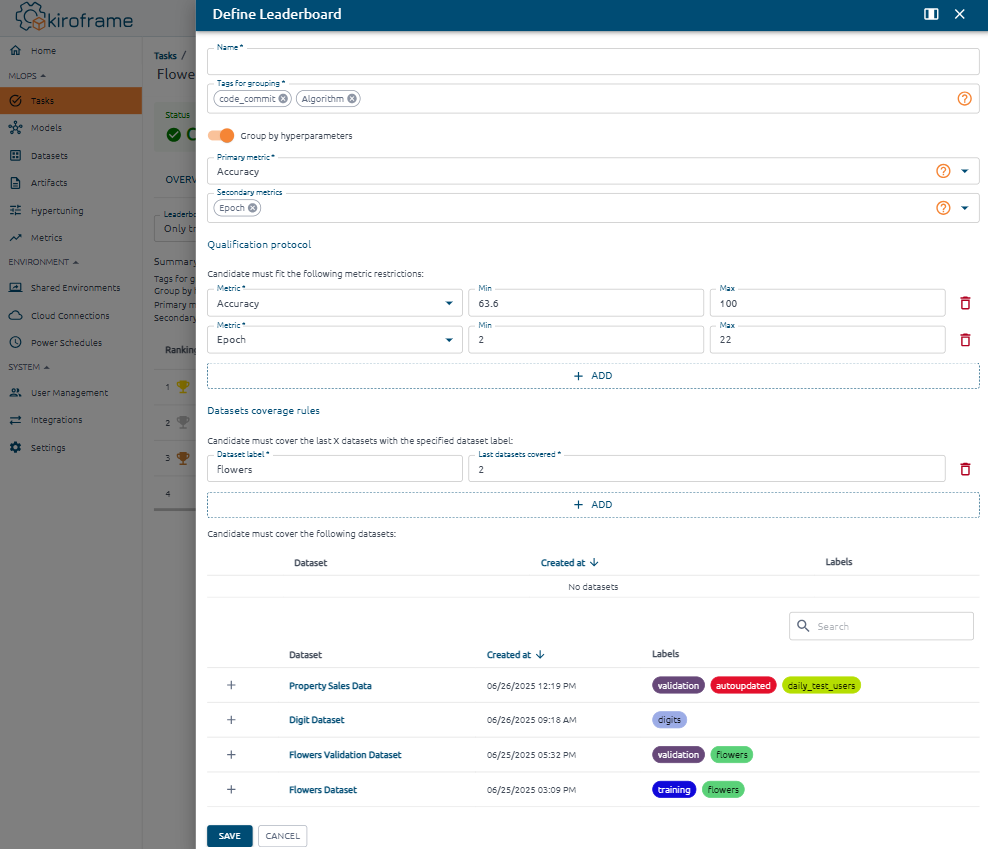
Create leaderboards#
To create a leaderboard click on ![]() to the right of the leaderboard selector.
to the right of the leaderboard selector.

By default, this form is pre-filled with data from the leaderboard template created earlier. Modify these details for each leaderboard as needed.
Manually add datasets that the candidate needs to cover using the Dataset navigator at the bottom of the page.
View results#
Go to the Tasks page, click on a task. Go to the Leaderboards tab and select the leaderboard from the list.
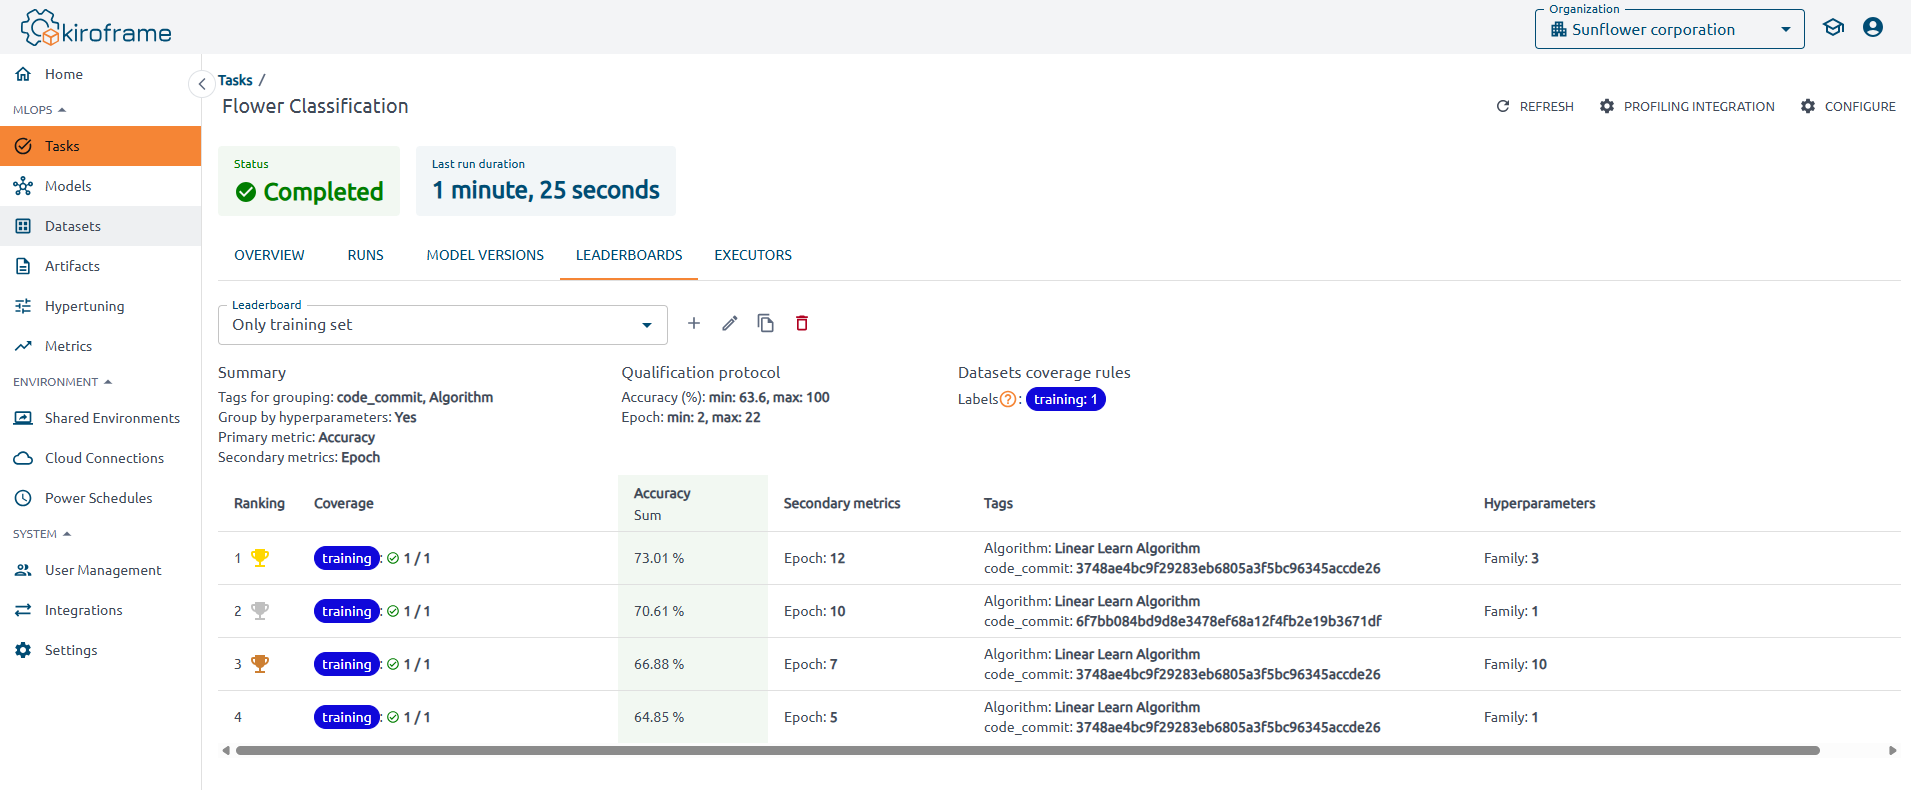
Find a ranking table below the leaderboard selector. Winners appear above the Qualification line.
If a group of runs has covered all datasets from the Dataset Coverage Rules section, it will be listed among the winners. Otherwise, it will be listed in the Qualification section.
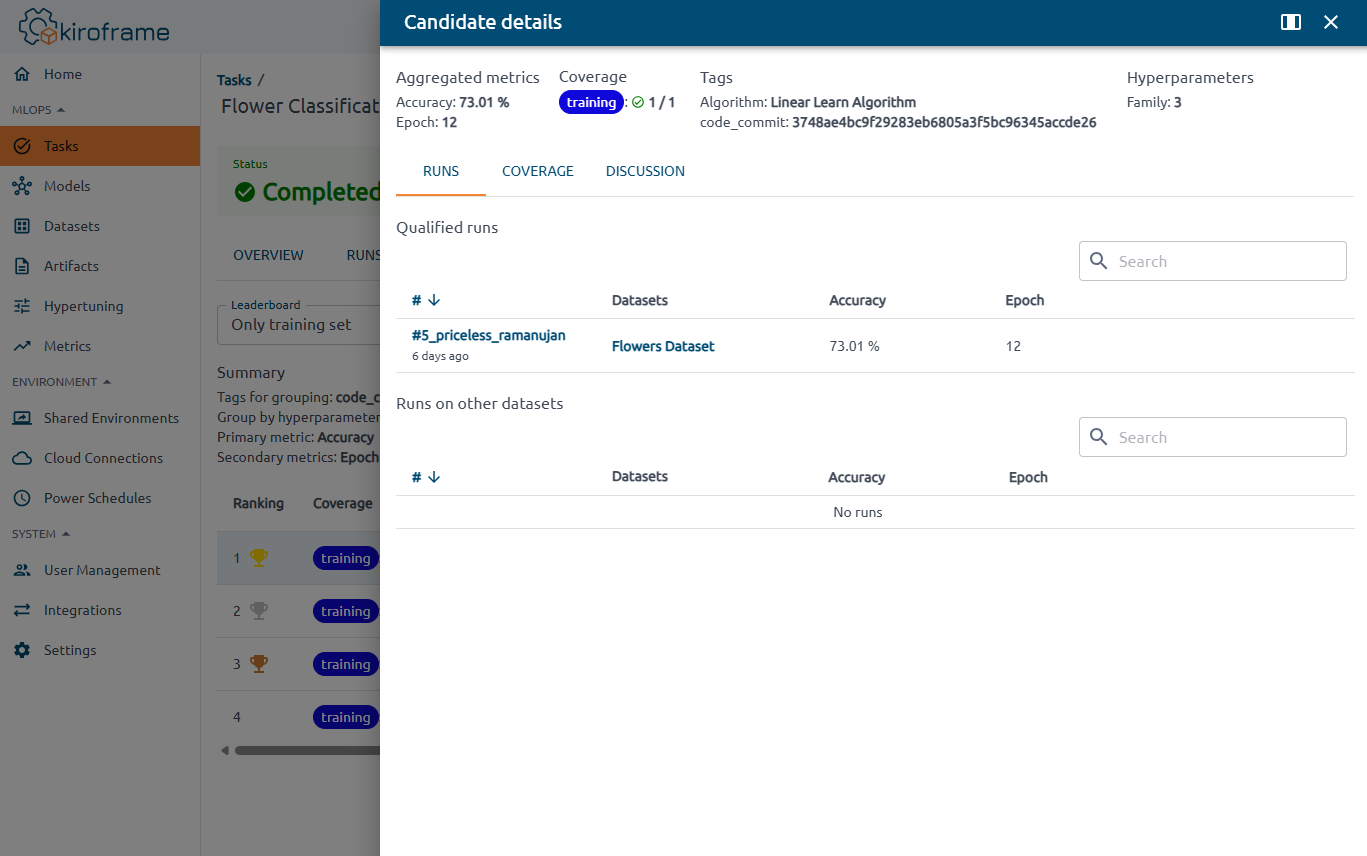
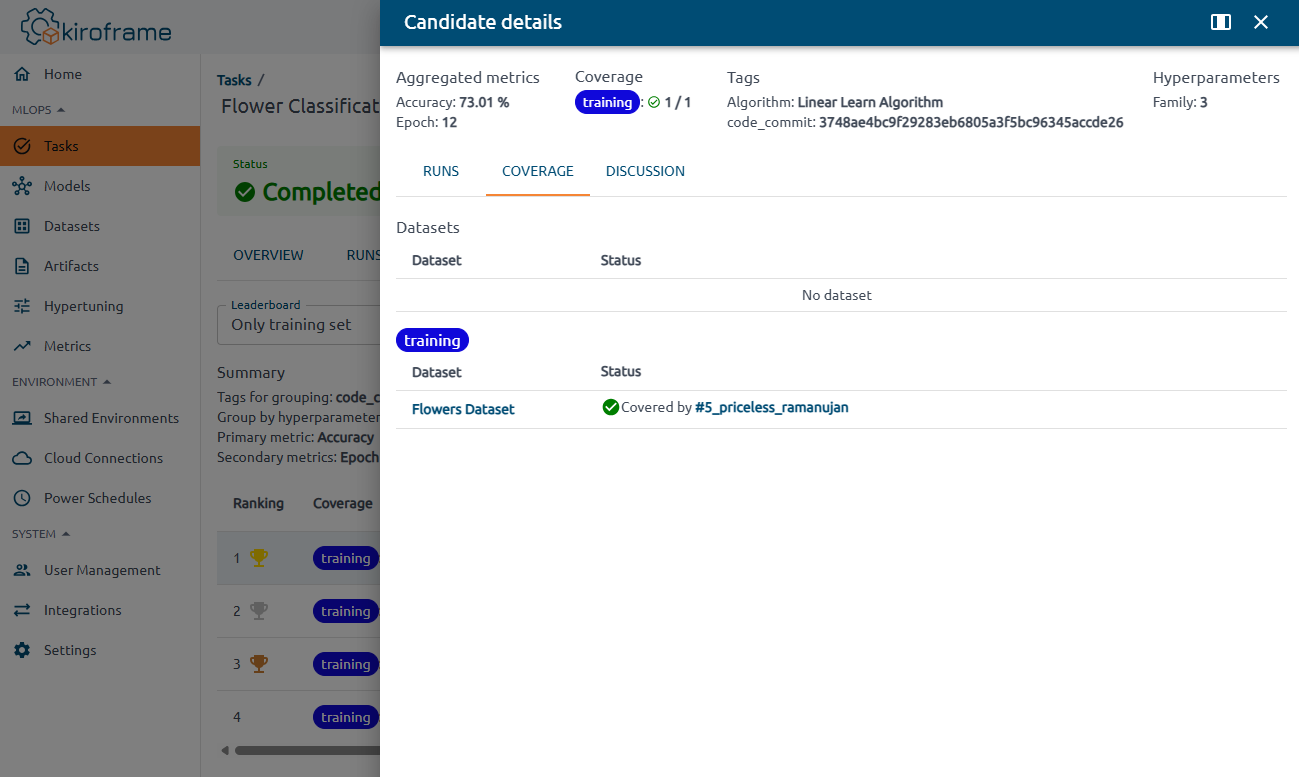
To view detailed information, click on a row in the table. This displays aggregated metrics, coverage, tags, and hyperparameters. Additionally, the information is organized into the Runs and Coverage tabs.
Runs tab#
Detailed information about the tags, hyperparameters, and metrics of each run in the group is shown here. The runs that covered the datasets specified in the Dataset Coverage Rules are also displayed.
Note
The Runs on Other Datasets section allows you to view promising runs on additional datasets.
Covarage tab#
Find the list of datasets from the Dataset Coverage Rules that were covered and those that were not.
Discussion tab#
Coming soon.
Executors tab#
The table displays all executors for every task run.